Analytics
The Analytics filtering system is a powerful tool designed to help you visualise the performance of your IoT devices and detect trends or unusual patterns. It provides a consolidated view of usage data for your Offers and SIMs. Using this tool, you can monitor usage at an Offer level across predefined periods and within the custom timeframes you define. Moreover, it allows you to delve deeper into specific SIMs and fine-tune the usage graphs and results for the chosen period.
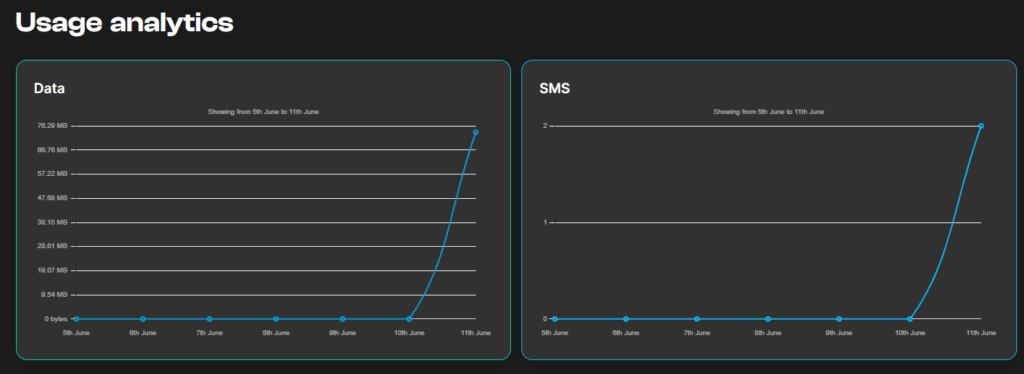
Upon entering the Analytics screen, you will find two graphs displaying Data usage and SMS usage at the Offer level over time.
The system offers filtering options based on ICCID, IMSI, SIM Label, and Offer Label for a specific date range. This empowers you to easily navigate through your data, gaining a comprehensive understanding of your usage patterns for the chosen period. Additionally, you can zoom in on a particular SIM or a group of SIMs associated with a specific Offer by selecting the relevant row. The charts and data will automatically update to display only the pertinent information.
The export feature allows you to extract the filtered view, enabling further analysis using external spreadsheet tools.